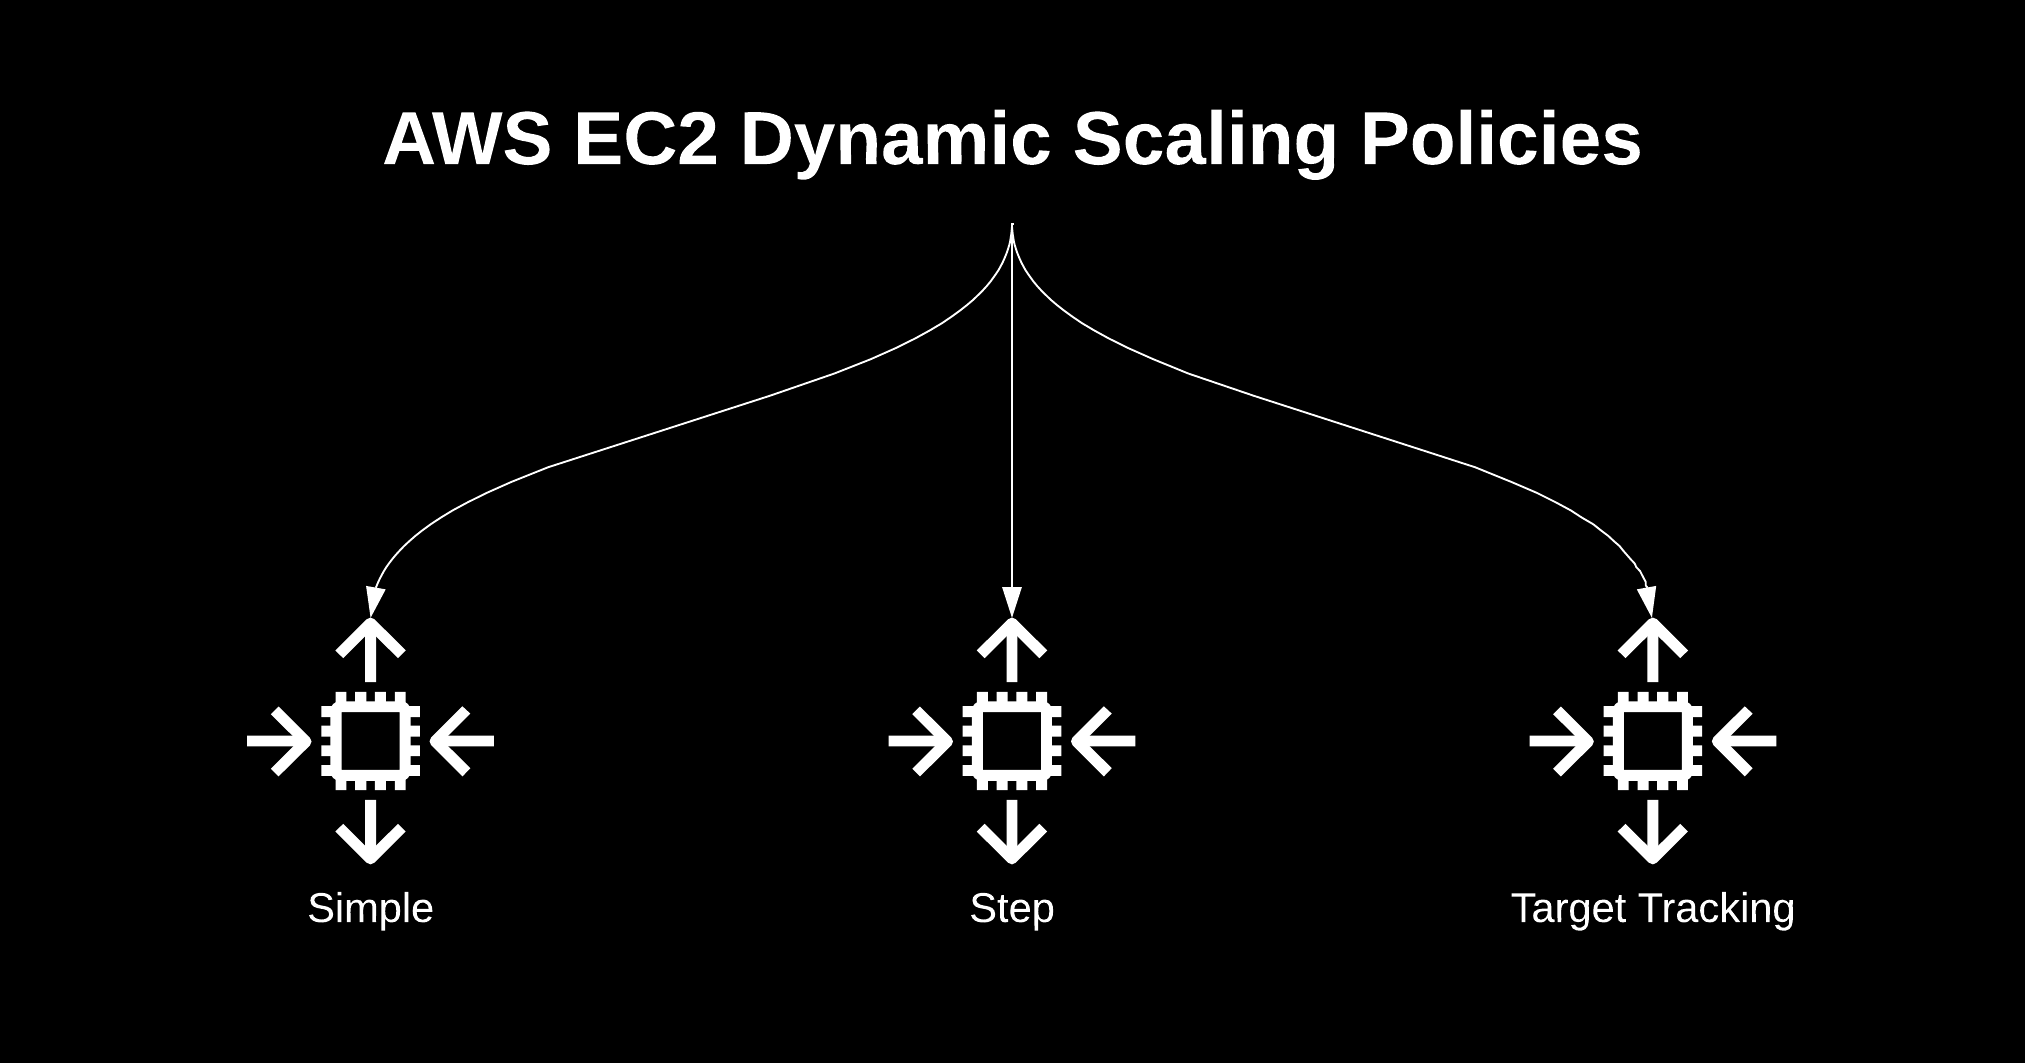
AWS offers three types of auto scaling policies for EC2 instances: dynamic, predictive, and scheduled.
- Predictive scaling uses AI to forecast capacity needs based on historical data.
- Scheduled scaling is similar to a cron job, adjusting capacity at predetermined time.
However, Dynamic scaling includes three sub-types: simple, step, and target-tracking. While they sound straightforward, choosing the right one can be challenging.
In this article, I’ll explore each dynamic scaling policy, discuss their use cases, and clarify when to use each one.
My Lab Environment Setup
- Three Auto Scaling Groups: One for each scaling policy.
- Ec2 Instance: Amazon Linux 2023, Spot Instances of type t3a.micro.
- Monitoring and Alarm: CloudWatch alarms based on the AutoScalingGroup’s Average CPU Utilization.
- Load Testing: Using a third-party tool called Stress to generate CPU load for demonstration, and manually changing the CloudWatch alarm state to
ALARMusing the AWS CLI. - Infrastructure as Code: 📂 Poject source code 🔗 is available in both CloudFormation and Terraform.
Simple Scaling
This is the most basic and oldest option offered by AWS.
The workflow for this policy is straightforward. If a condition is met, then a specific action is taken, similar to a basic “if-else” statement.
To use it, you first need to create CloudWatch alarms that trigger the policy for scaling in and out. You need to create these alarms yourself and link them to the scaling policy.
You can choose custom metric for the alarms, such as memory usage, network traffic, or even SQS queue length. In this case, I chose the Average CPU Utilization of the same Auto Scaling Group where this policy is attached.
One important point to note is that there is a strictly enforced cooldown period 🔗 . After scaling in or out, the autoscaling group must wait for this cooldown period to expire.
During this time, the autoscaling group cannot add or remove instances, and any triggers that occur will be rejected and missed.
Let’s build this.
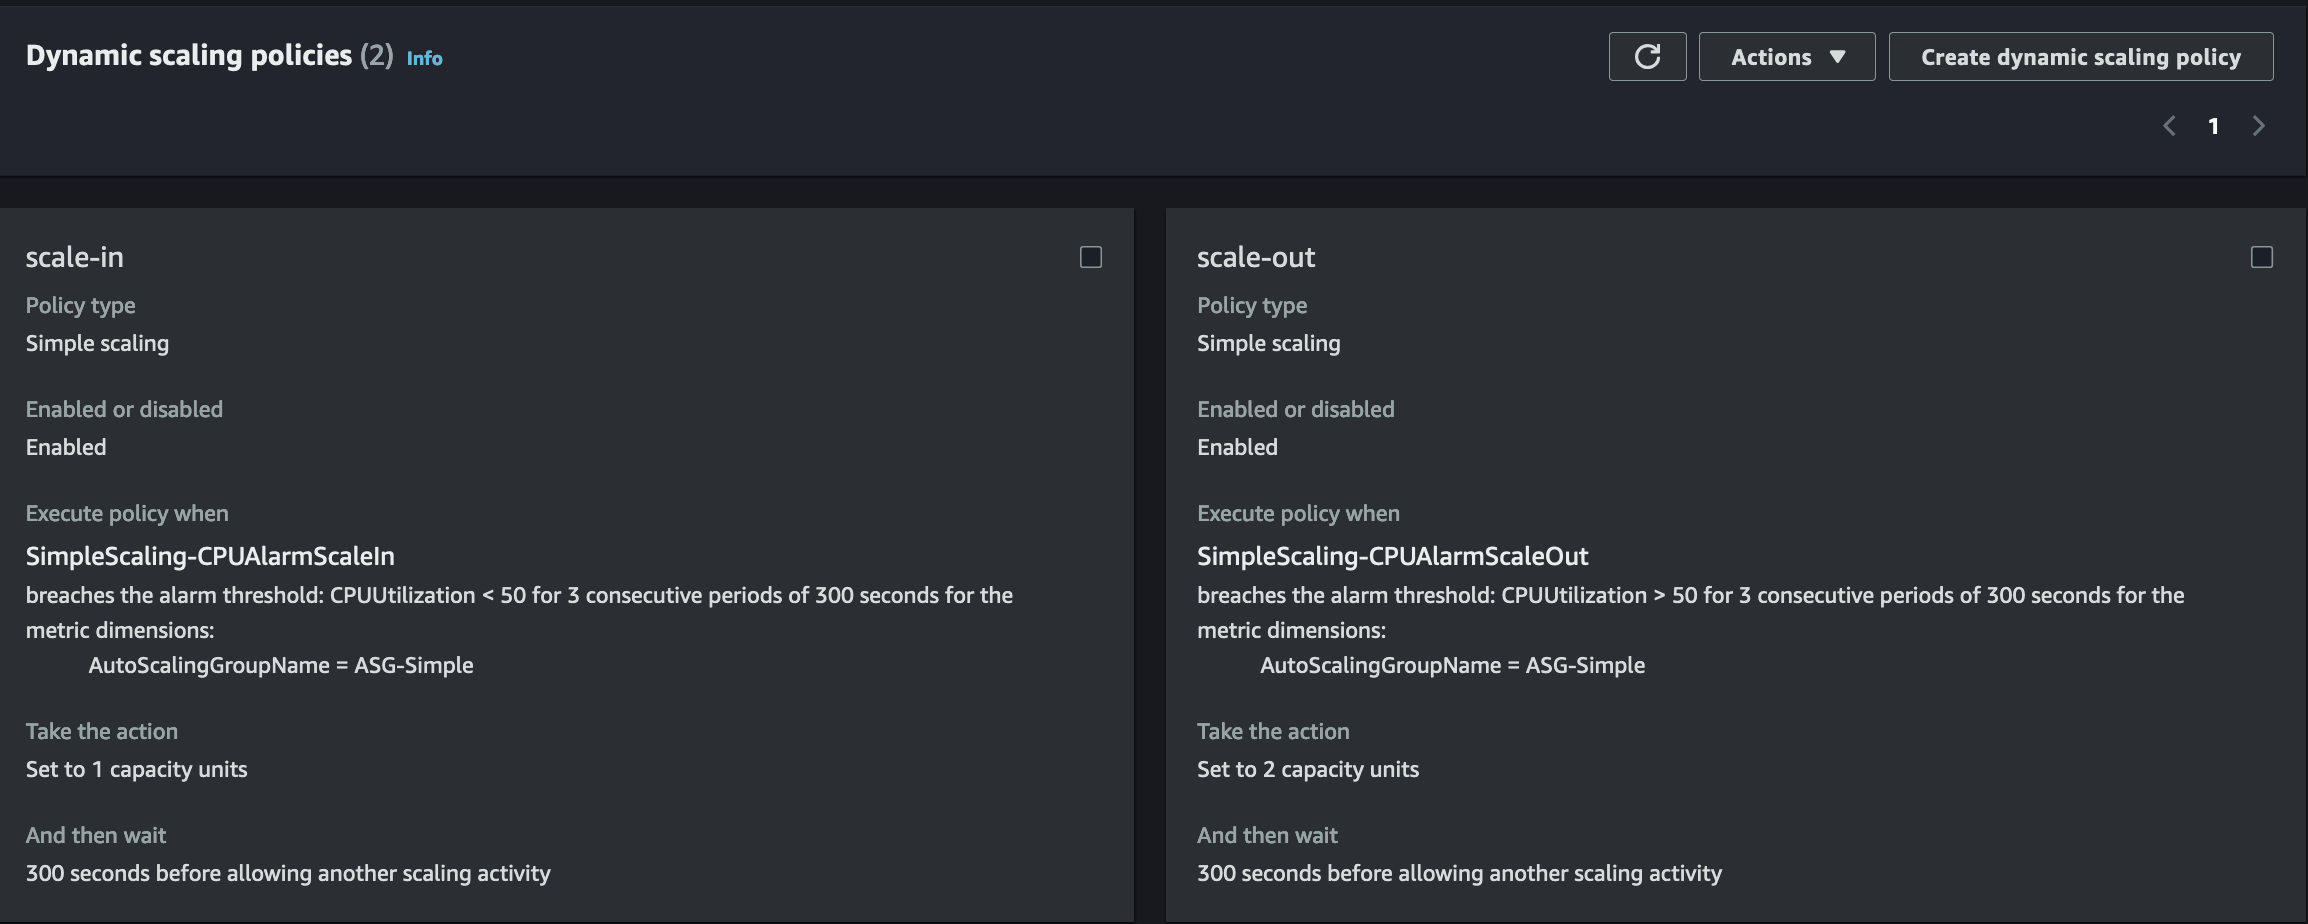
Scenario: I want to scale up to 2 instances when the average CPU utilization exceeds 50% and scale down to 1 instance when it drops below 50%.
For the adjustment type 🔗
, I’ve chosen ExactCapacity, but ChangeInCapacity and PercentChangeInCapacity are also options.
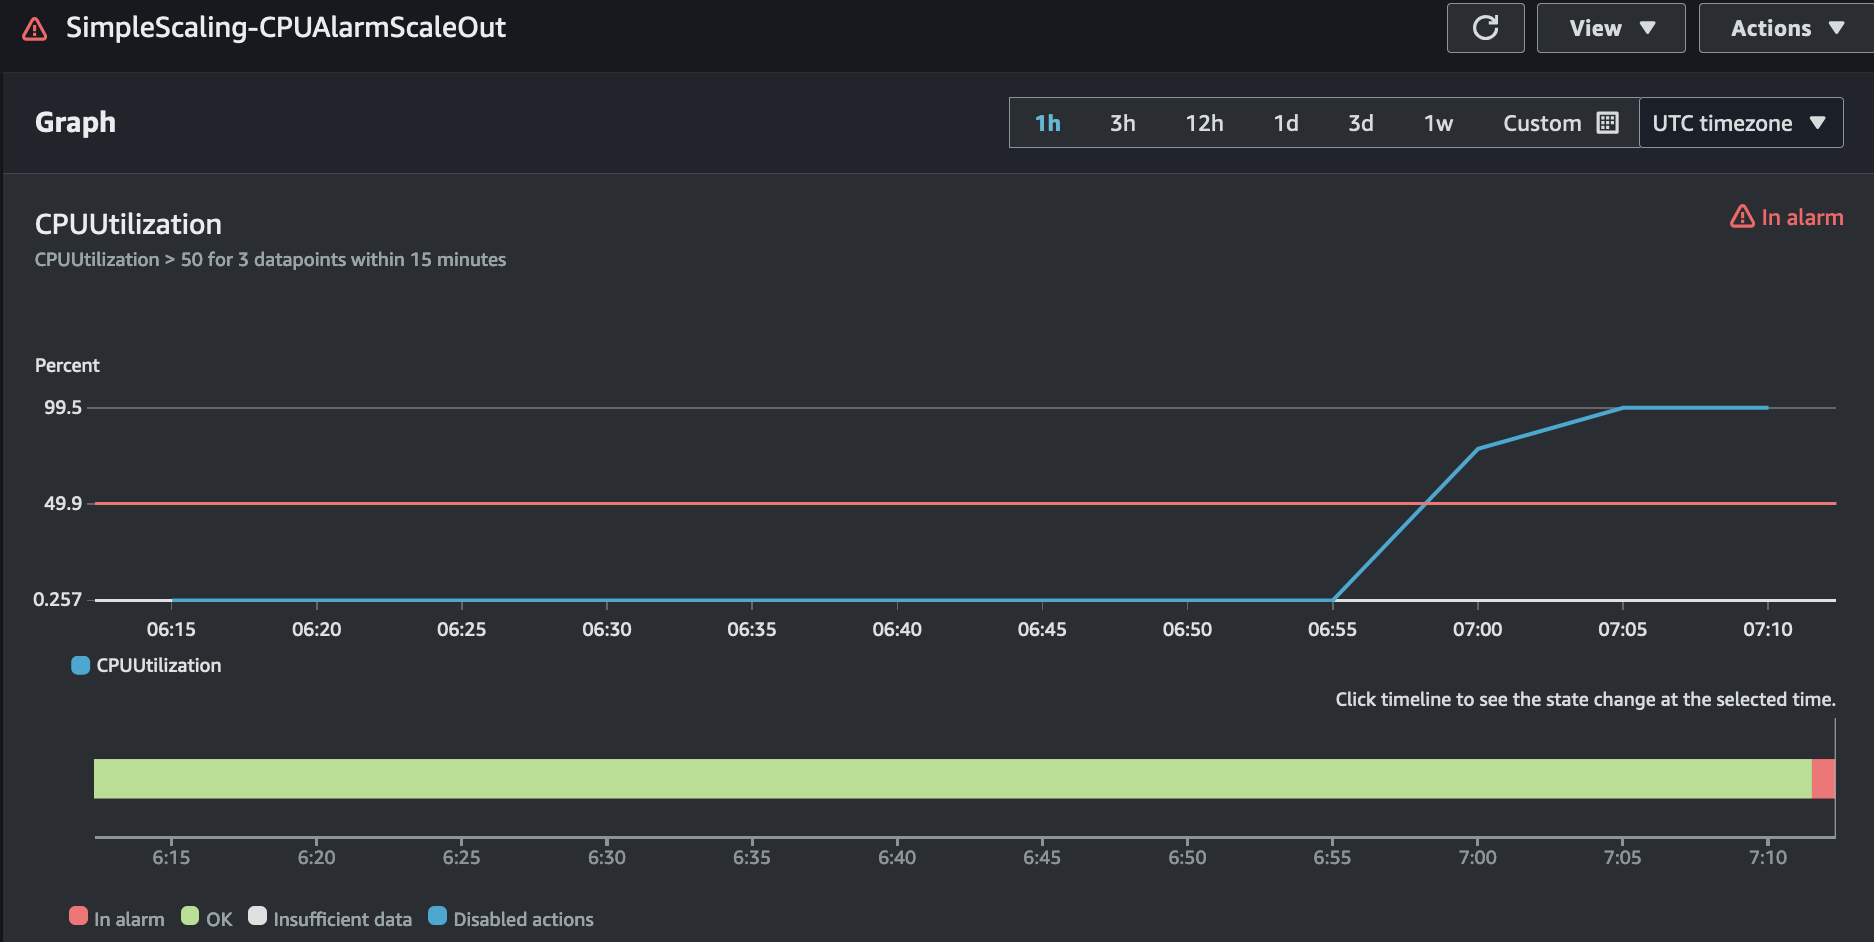
I’ve set up 2 policies scale-in and scale-out. For this I also have created 2 alarms for each with 50% threshold.
Scaling Policy:
CloudWatch Alarm:
Step Scaling
I see this as an upgraded version of simple scaling. Instead of a basic ‘if-else’ statement, step scaling is a concept of an ‘if-elseif-else’ structure.
Similarly, to use it, you need to create CloudWatch alarms and link them to the scaling policy yourself.
Again, I chose the Average CPU Utilization of the same Auto Scaling Group where this policy is attached.
Unlike simple scaling, it scales immediately without waiting for the cooldown period to end. Instead, it uses an instance warmup period 🔗 , which allows new instances to stabilize before they start reporting metrics in CloudWatch for monitoring.
When configuring, it’s important to understand the workflow of step adjustments. You get two bounds interval: the lower interval(minimum threshold) and the upper interval(maximum threshold) of a specific metric.
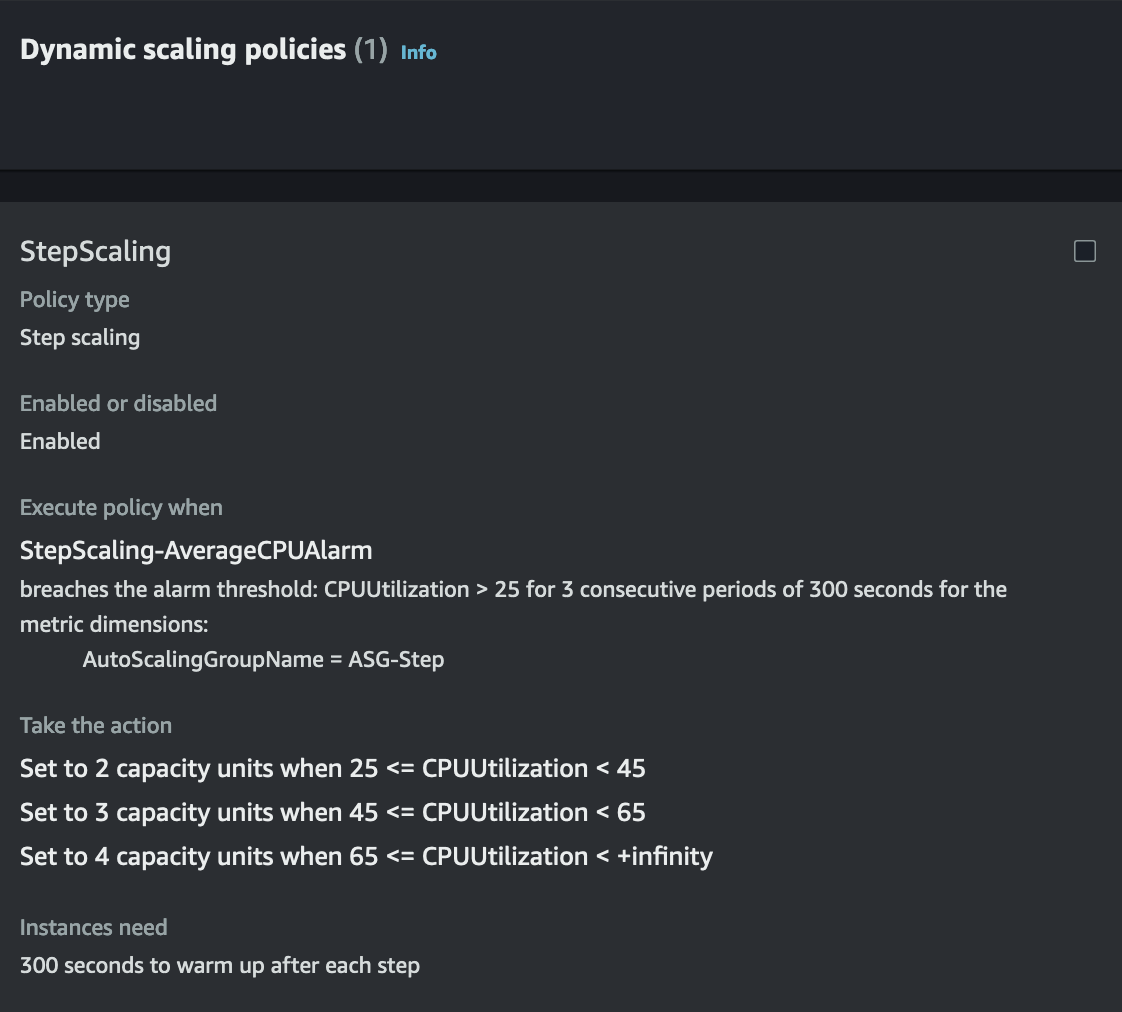
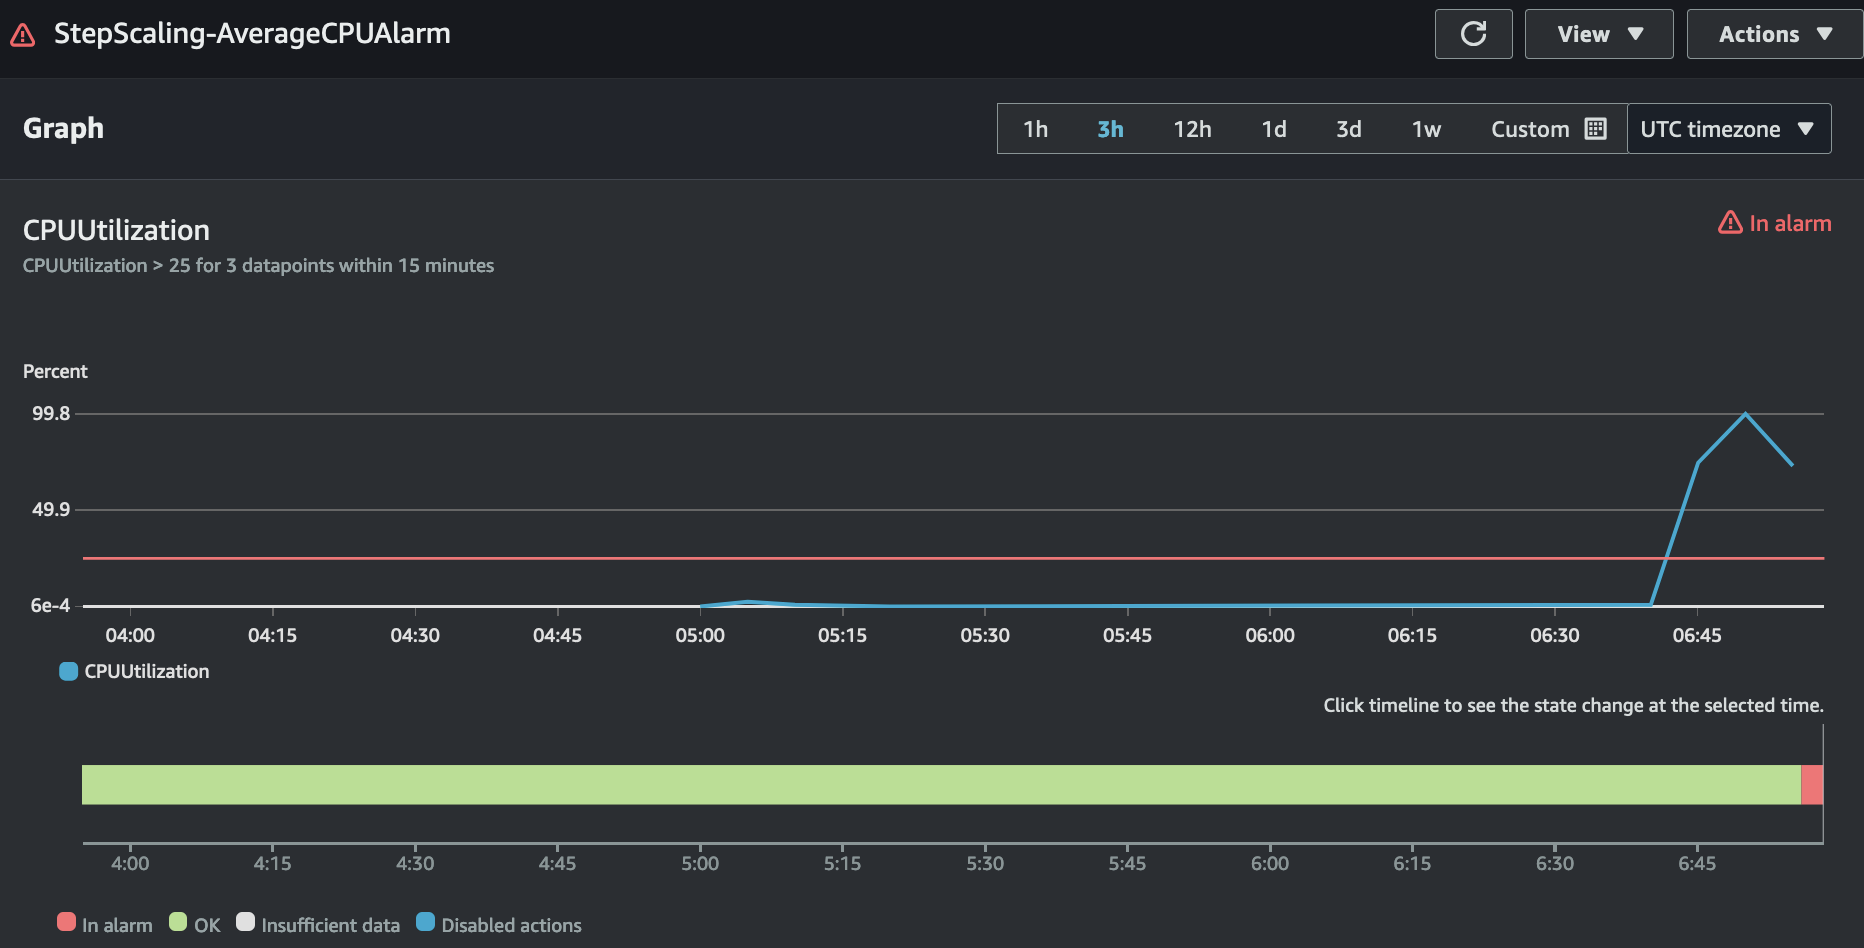
Now, let’s consider a scenario where I want to set an average CPU alarm at 25%.
Here’s how I can configure the step adjustments:
- If the alarm threshold is above 25% and below 45%, set the capacity to 2.
- If the alarm reaches between 45% and 65%, set the capacity to 3.
- If the alarm goes above 65%, set the capacity to 4.
The step adjustments would look like this:
StepAdjustments:
  - MetricIntervalLowerBound: '0'
    MetricIntervalUpperBound: '20'
    ScalingAdjustment: '2'
  - MetricIntervalLowerBound: '20'
    MetricIntervalUpperBound: '40'
    ScalingAdjustment: '3'
  - MetricIntervalLowerBound: '40'
    ScalingAdjustment: '4'
To understand how bounds work, simply add bound values to the alarm metrics. The alarm is set at 25%, with a lower bound of 0 and an upper bound of 20. This means that the effective range for scaling adjustments is from 25% to 45%.
Note that in the last adjustment, I’ve used only a lower bound of 40 without an upper bound. This means that if the CPU usage exceeds 65%, the capacity adjustment will be 4, regardless of how high it goes (e.g., above 65%)
Scaling Policy:
CloudWatch Alarm:
Target Tracking Scaling
This is the easiest scaling policy to use because it operates automatically.
Simply select a metric and provide a target value you want to maintain. The policy will automatically adjust instance capacity to keep you at your target value.
It includes built-in CloudWatch metrics 🔗 that can automatically create alarms linked to the scaling policy. Just ensure you set appropriate min and max capacity values in policy.
You can also create custom CloudWatch alarms using the AWS CLI or SDK.
One important thing to consider is that you need to enable the scale-in feature in your scaling policy; it isn’t enabled by default.
If it’s not enabled, the policy will only add capacity and won’t remove instances when utilization falls below the threshold, which can lead to increased costs.
Similarly, scaling capacity is not affected by the cooldown period; instead, it relies on instance warmup.
Here’re some workflow on how automatic scaling occurs with instance warmup:
- If you have 4 active instances and 2 are still warming up, the policy will only add new instances if the average utilization of the 2 active instances is higher than the threshold.
- Scale in, or removing instances won’t happen if the group has instances in the warm up state.
You can find more information here 🔗 .
Let’s take a scenario.
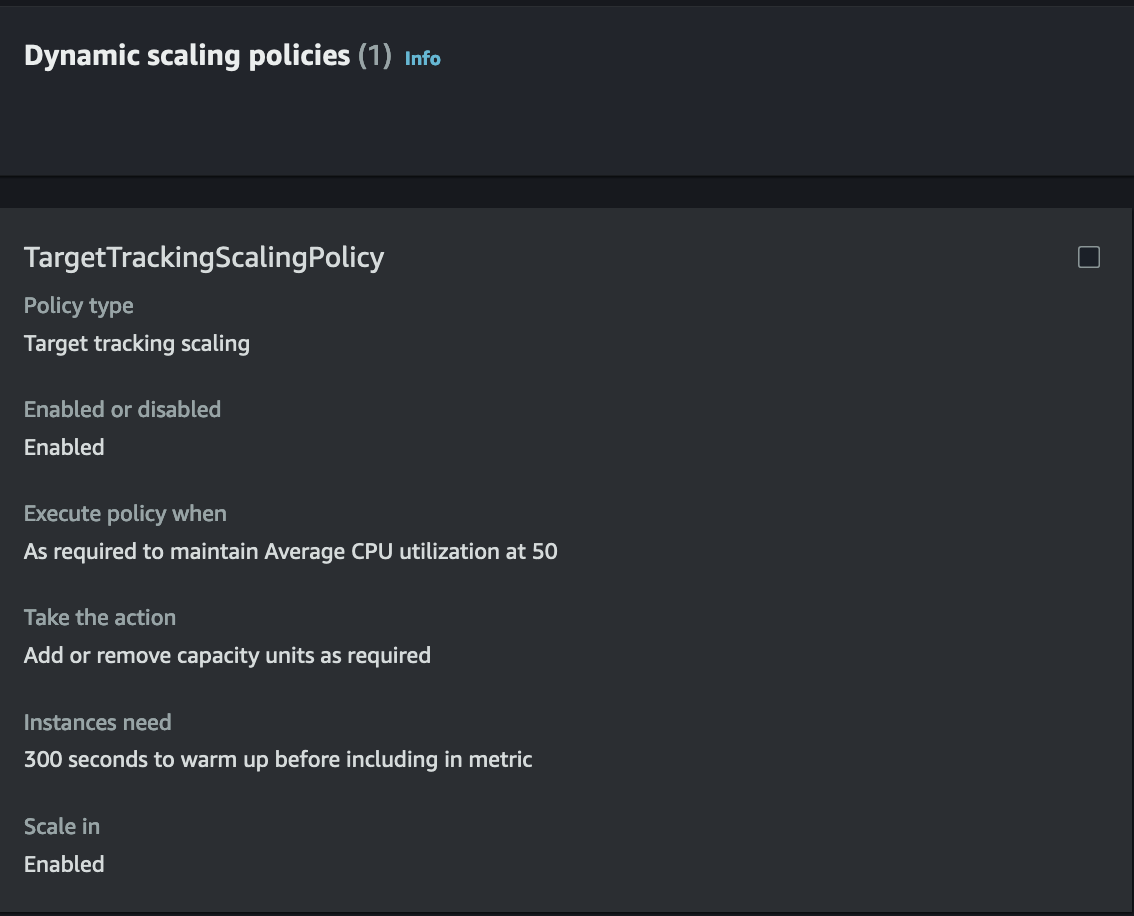
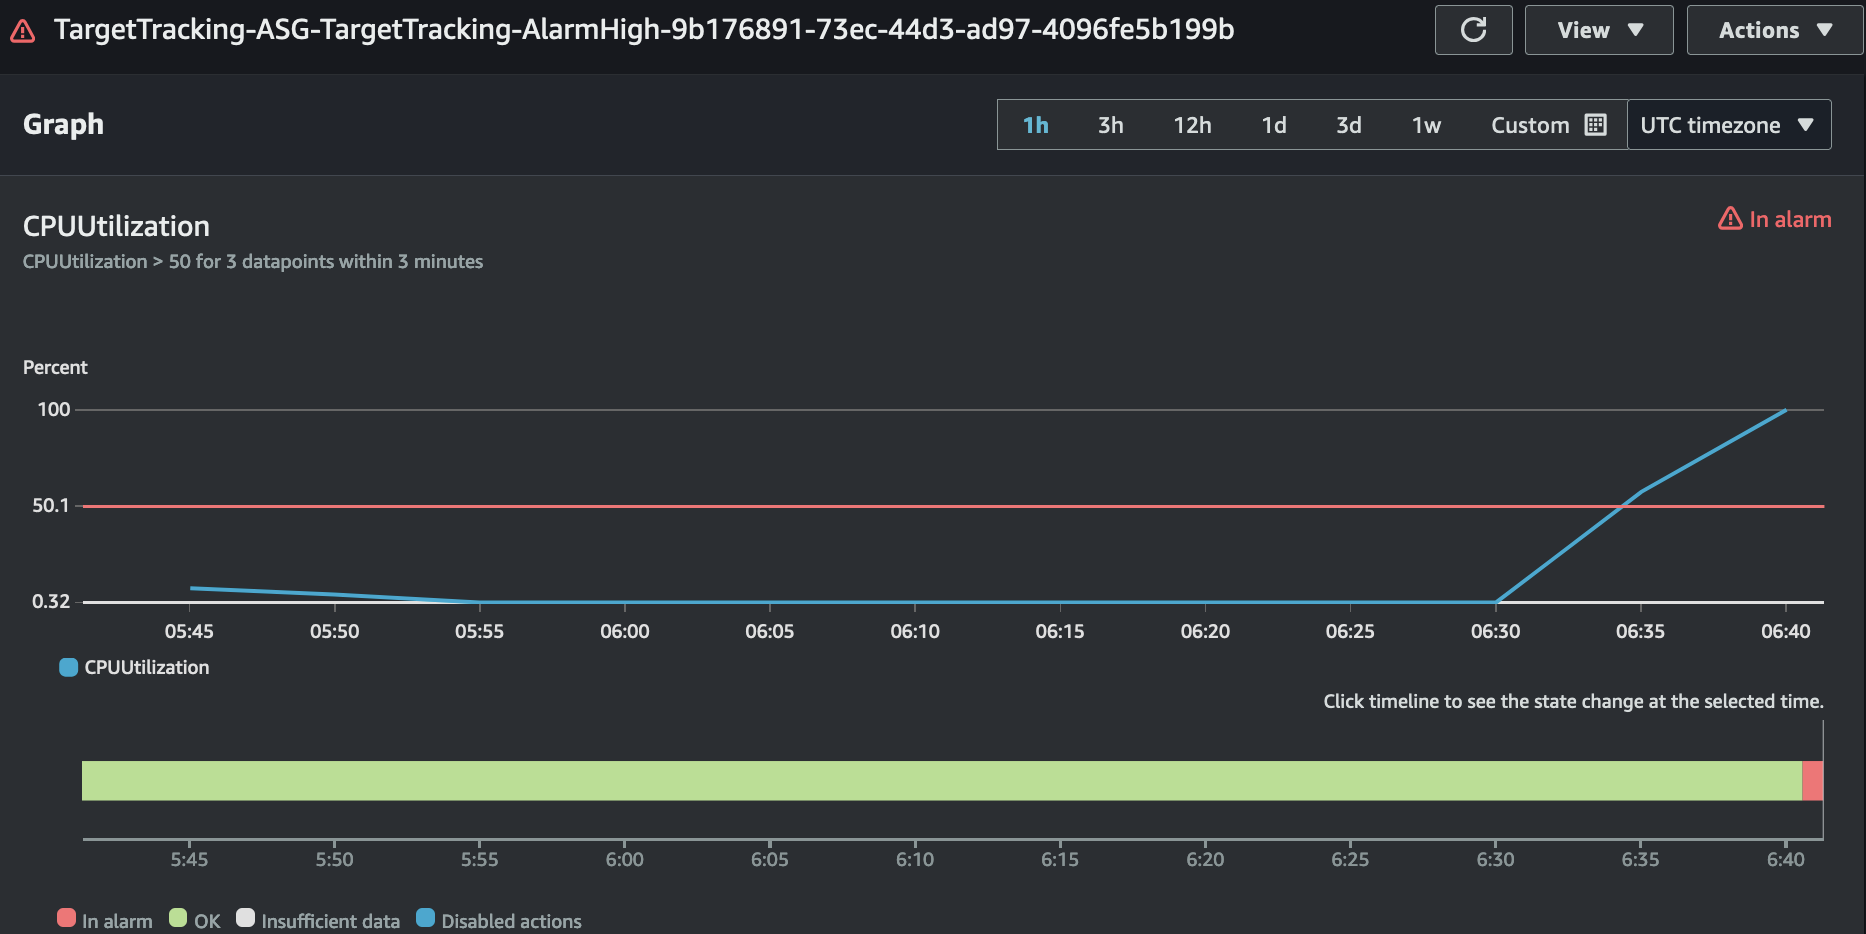
I’ve an application that gets affected if the average CPU utilization exceeds 50%, so I want to maintain it at that level.
I chose the built-in ASGAverageCPUUtilization metric provided by Target Tracking and set the target to 50%. Also, configured the min capacity to 1, desired capacity to 2, and max capacity to 4.
This setup will automatically adjust the capacity to maintain my CPU utilization at 50%.
Scaling Policy:
CloudWatch Alarm:
Use Case
Each scaling policy has its own features, and with proper knowledge, you can implement any of these in various real-world scenarios.
Simple Scaling
- Complexity: Straightforward and simple, but offers less flexibility.
- Use Case: Ideal for applications with consistent and predictable traffic patterns.
Step Scaling
- Complexity: More complex; requires defining multiple thresholds and actions.
- Use Case: Suitable for fluctuating traffic that benefits from incremental adjustments rather than large, direct changes.
Target Tracking Scaling
- Complexity: Easy to set up.
- Use Case: Best for applications with unpredictable traffic patterns, allowing for automatic adjustments.
Consideration
Always test and set the optimal min and max capacity for your auto scaling group. This helps prevent underutilization or overprovisioning, allowing for cost savings.
You can use multiple scaling policies within the same group for more flexibility, but they can conflict with each other. Adjustments may be needed when adding or removing policies to avoid issues.
AWS recommends using step or target tracking scaling for more flexibility instead of cooldown periods with simple scaling. However, if you prefer simplicity, simple scaling is still an option.
You can create custom metrics for scaling, and some best common metric choices are cpu usage, memory usage, network traffic, and ALB request count.
Remember that CloudWatch alarms only trigger scaling policies when their thresholds are met. The scaling policy defines how much to scale and how many instances to add or remove.
To prevent manual intervention, prefer target tracking. It is AWS’s managed option for automatic adjustments.
AWS recommends using metrics that update every minute for quicker response to usage changes. By default, Amazon EC2 metrics update every five minutes, but you can change this frequency, which may increase costs.
Set up monitoring for your Auto Scaling Group and configure activity events for alerts and notifications.
I hope you enjoyed the post, and I would love to hear your feedback in the comments below!
Thanks for reading,
-Alon
